Despite dropping $4000 from highs, ETH/USD price action remains bearish
Head and shoulders pattern indicates more downside
A bearish flag pattern supports short-sellers
Traders are often impatient for a market to move. Long periods of price consolidation lead to overtrading or giving up on an idea simply because the market did not move.
This is particularly true in the crypto market. Known for its high volatility, it brought fortunes to many traders as quick moves resulted in quick profits.
For instance, ETH/USD rose from $1000 in 2021 to $5000 in 2022. The ones that bought and held onto their traders for a year saw their accounts increasing exponentially.
But trading is a story of both winning and losing. Not everyone wins. In fact, most retail traders lose money trading. It is easy to say that you might have bought ETH/USD at $1000 and close it at $5000. How about buying at $5000 on fears of missing out on an even bigger move, only to see the market crashing back to $1000.
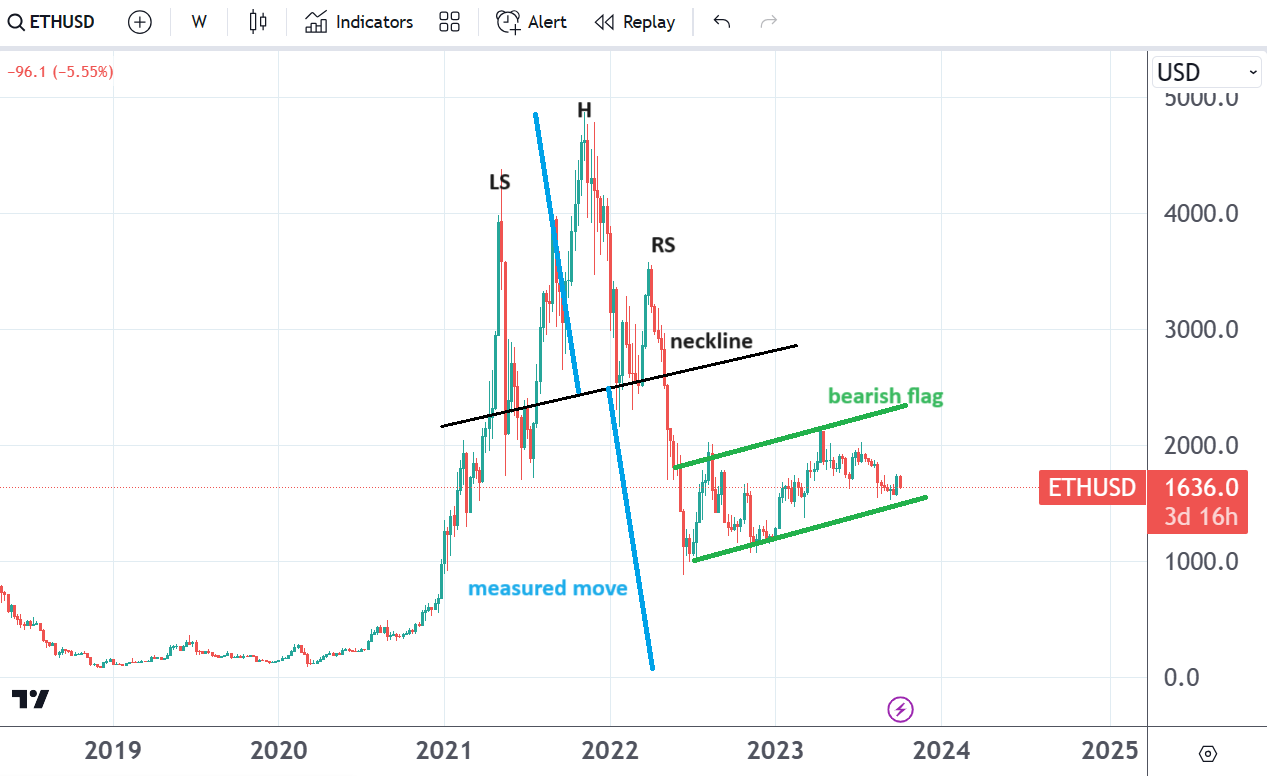
Sure enough, plenty of traders have bought into the dip. And, even though ETH/USD dropped $4000 from its highs, the bias remains bearish.

Ethereum chart by TradingView
ETH/USD bigger picture is a reason for bulls to worry
On its trip to $5000, ETH/USD formed a head and shoulders pattern. Once the price broke below the neckline, it found no support until it reached $1000.
The level marked the bottom of the year for the stock market and the highest point for the US dollar. Since then, stocks bounced sharply, and the cryptocurrency market followed.
But despite the rally at the start of 2023, the bigger picture remains bearish for ETH/USD. A bearish flag pattern should be a good enough reason for bulls to worry, as it is usually followed by more downside.
Bears would want to see the price dropping to $1000 once more. It would mean that the bearish flag pattern ended and that the next target is the head and shoulders’ measured move.
On the other hand, bulls may want the price to simply stay in the flag and test the upper edge of it. This is the only way to invalidate a bearish flag pattern.


Be the first to comment