At the start of April, the price of Polygon (MATIC) experienced a breakdown from a long-term pattern, and its rate of decline intensified in the past week.
The wave count analysis suggests that the upward movement is likely to persist. Although there is a possibility of a temporary rebound in the price, probably, the downward movement is not yet complete.
Polygon Price Bounces but Trend Still Bearish
The technical analysis for MATIC on a weekly basis gives a strongly pessimistic outlook. There are multiple factors contributing to this viewpoint.
To begin with, in April 2023, the price broke below a long-term ascending parallel channel. This signifies the conclusion of the previous upward movement.
Additionally, since these channels typically contain corrective patterns, the breakdown suggests that the prior increase was corrective in nature. Consequently, the prevailing trend is likely to be bearish.
Currently, the MATIC price is trading above the $0.53 horizontal support level, where it bounced at the beginning of June (green icon).
Furthermore, the weekly Relative Strength Index (RSI), which market traders utilize as a momentum indicator to detect overbought or oversold conditions and determine whether to accumulate or sell an asset, indicate a bearish reading.
The RSI is below 50 (red icon) and declining, indicating a downward trend.
MATIC Price Prediction: Wave Count Gives Bearish Outlook
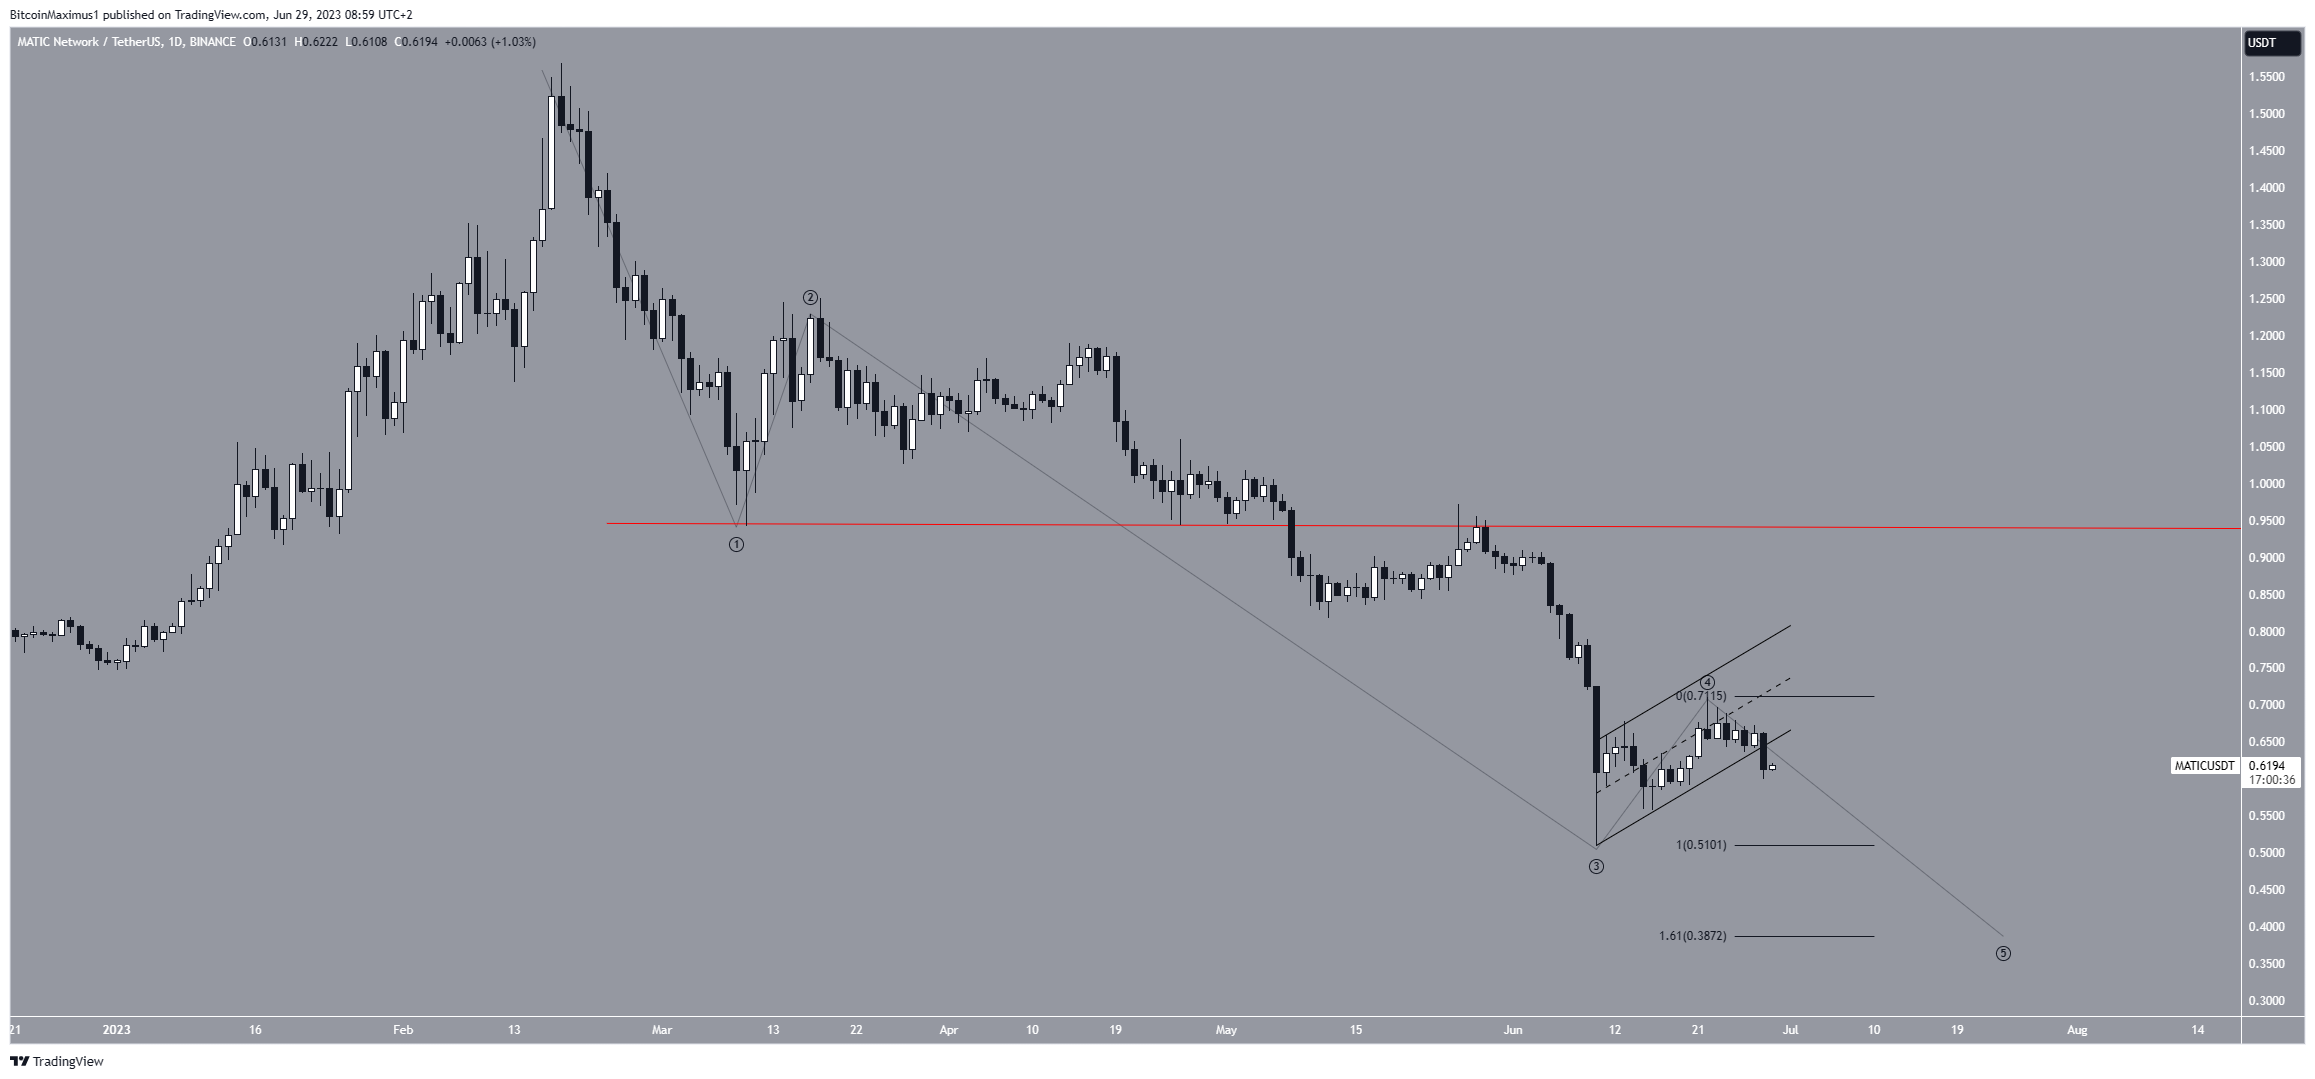
The short-term daily time frame analysis also presents a bearish outlook due to the wave count.
Technical analysts utilize the Elliott Wave theory to identify recurring patterns in long-term prices and investor psychology, aiding them in determining the trend’s direction.
Based on the most probable count, the current price action for MATIC suggests it is in the fifth and final wave of a decline (black). If this count is accurate, the price is expected to fall to a low of $0.39.
The target is given by the 1.61 external Fib retracement of wave four.
Moreover, the price action supports the bearish wave count. The MATIC price broke down from an ascending parallel channel, a sign that suggests the corrective wave four is done.

Reclaiming the channel’s support line would suggest that the bounce could continue despite the bearish MATIC price prediction.
However, the bearish prediction will only be invalidated with a move above the bottom of wave one (red line). In that case, an increase to $1.30 will be likely.
For BeInCrypto’s latest crypto market analysis, click here.
Disclaimer
In line with the Trust Project guidelines, this price analysis article is for informational purposes only and should not be considered financial or investment advice. BeInCrypto is committed to accurate, unbiased reporting, but market conditions are subject to change without notice. Always conduct your own research and consult with a professional before making any financial decisions.


Be the first to comment